All guides
Find your way around Insights
The five tabs, the numbers along the top, and what each chart is actually counting.
Insights summarises records that authorised staff have created in Vero. Where History lists individual entries, Insights presents counts and recorded durations for a selected date range.
The five tabs
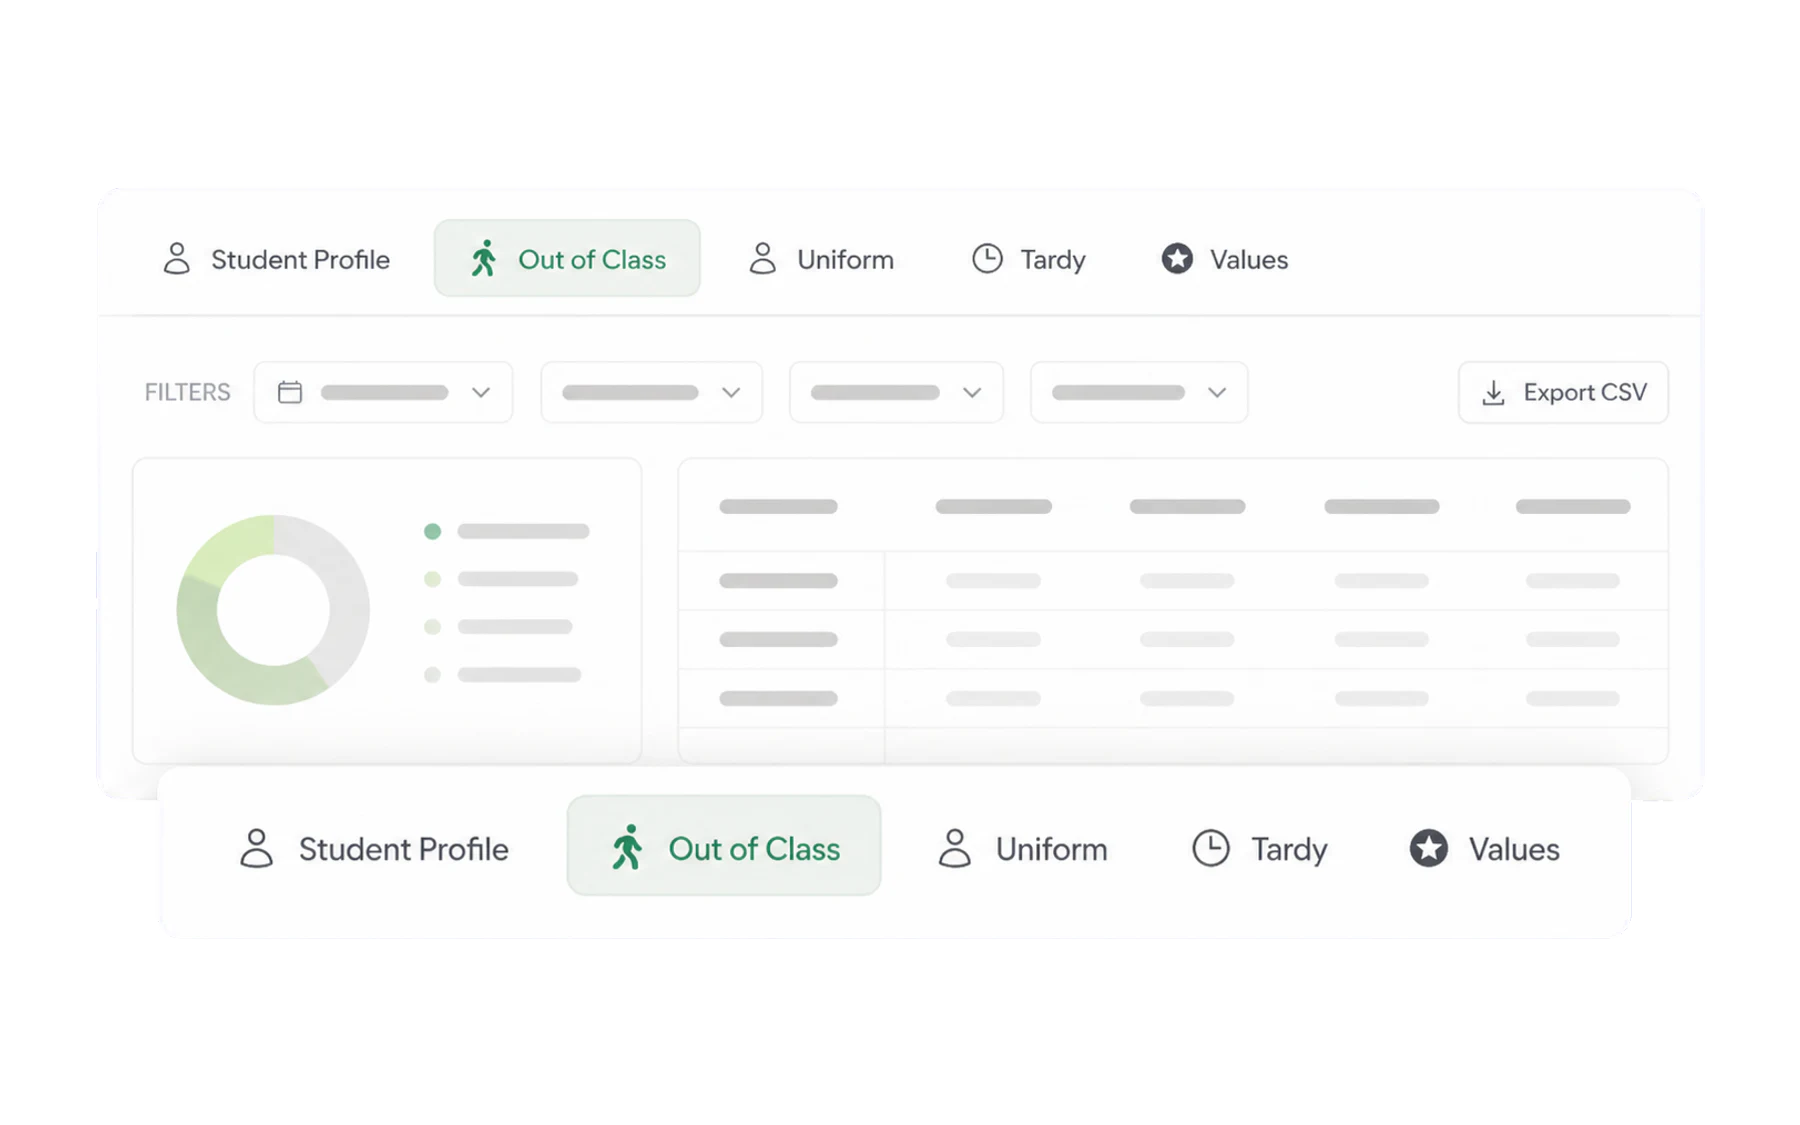
- Out of Class — passes: volume, destinations, duration, class time lost.
- Uniform — infringements by type, year level and week.
- Late to Class — late arrivals, by period and by student.
- Values — awards given, by value and by cohort.
- Student Profile — related Vero records for one named student. Read a student’s profile.
You only see the tabs for modules your school has switched on.
The numbers along the top
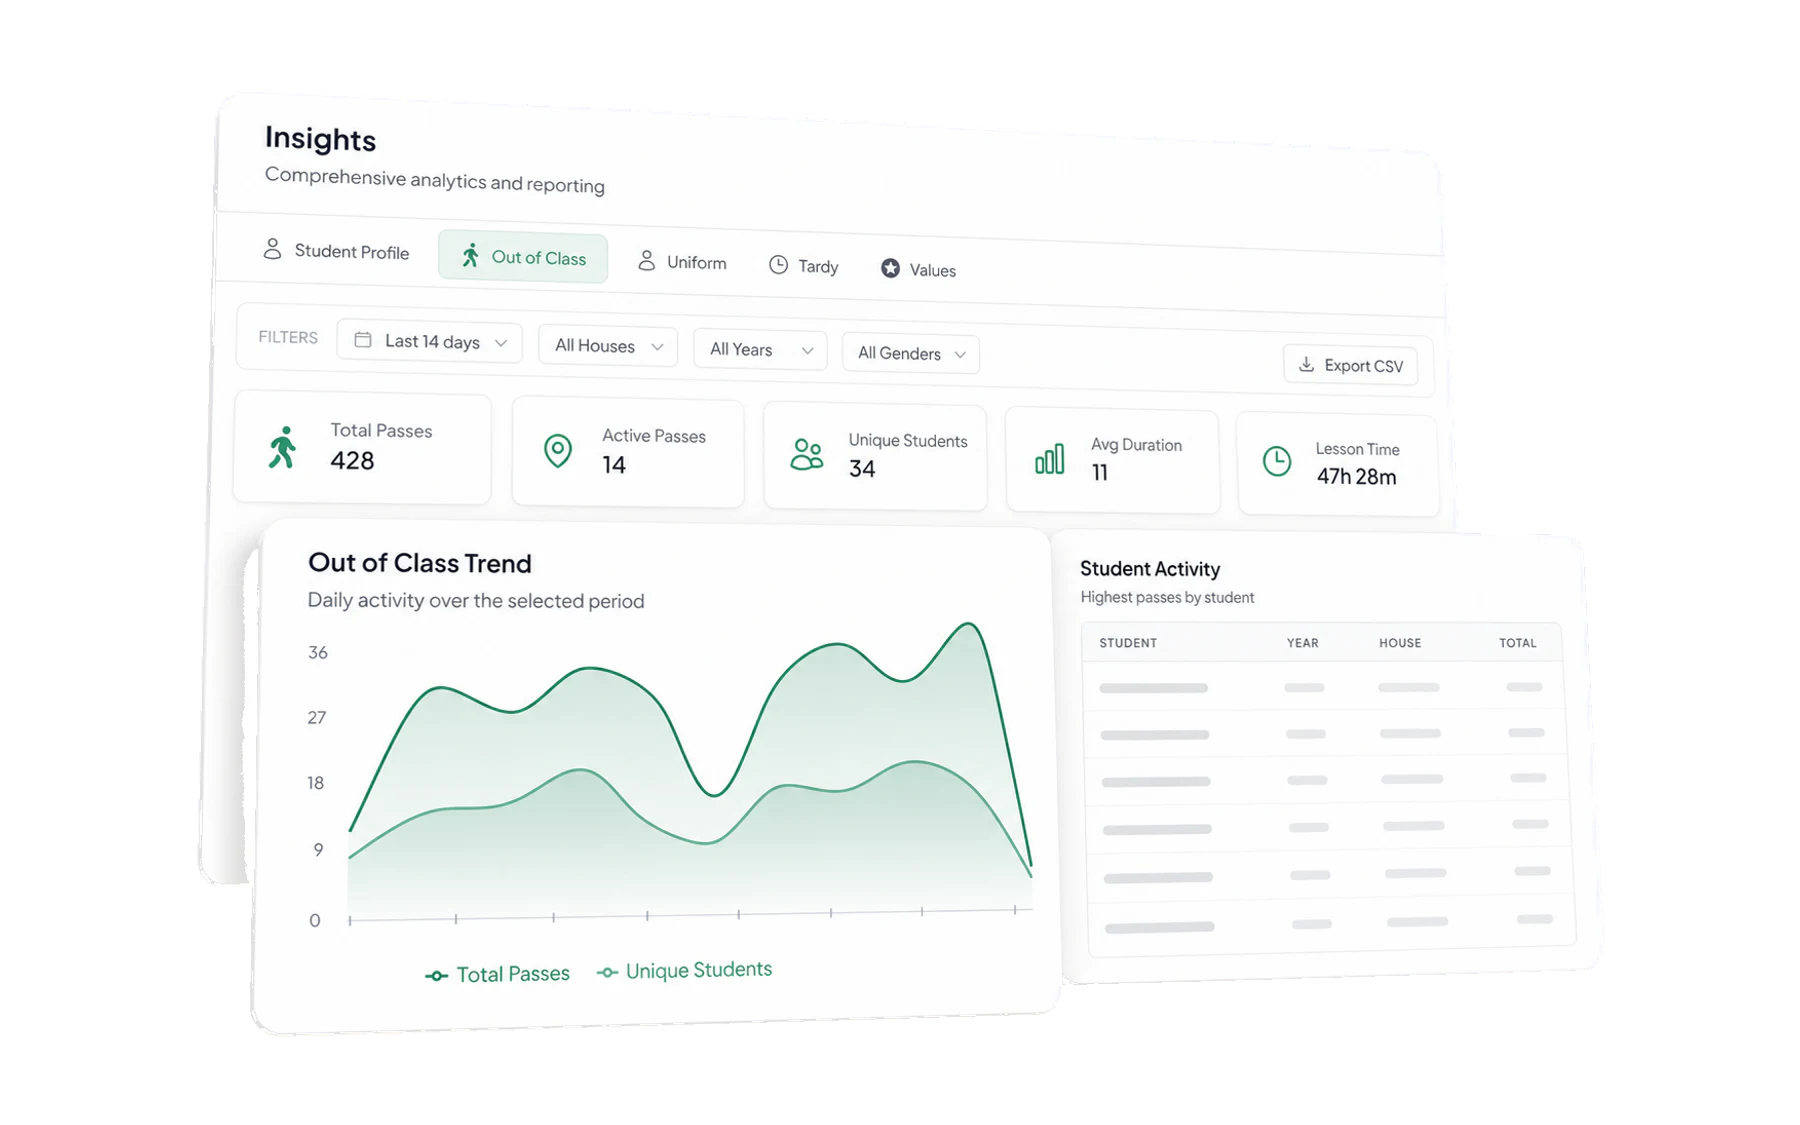
On the Out of Class tab:
- Total Passes — passes issued in the selected window.
- Active Passes — pass records that are currently open. This is not a verified location feed.
- Unique Students — how many different students. Read this next to Total Passes: 300 passes from 25 students is a very different school from 300 passes from 200 students.
- Avg Duration — the typical length of a pass. Compare it to your time limit.
- Lesson Time Missed — the interface label for recorded open-pass time added together. It does not verify physical absence or learning missed.
The charts
- Out of Class Trend plots passes and unique students per day. When the two lines move together, both the number of entries and students represented changed; when pass counts rise without a similar change in unique students, more entries were recorded for a smaller group.
- Student Activity lists pass-record counts with year and house. It is a record summary, not a ranking, behaviour score, risk score, or list of students who need intervention.
Narrowing it down
Every tab carries the same filter row — date range, house, year level, gender — and an export button. See Ask Insights a question and Export to CSV.