All guides
Ask Insights a question
Date range, house, year level and gender — how to turn a leadership question into three clicks.
The filter row is the whole of Insights. Everything below it — the totals, the charts, the tables, the export — recalculates from whatever you set here. Learn this row and you can answer most questions a leadership meeting produces in about three clicks.
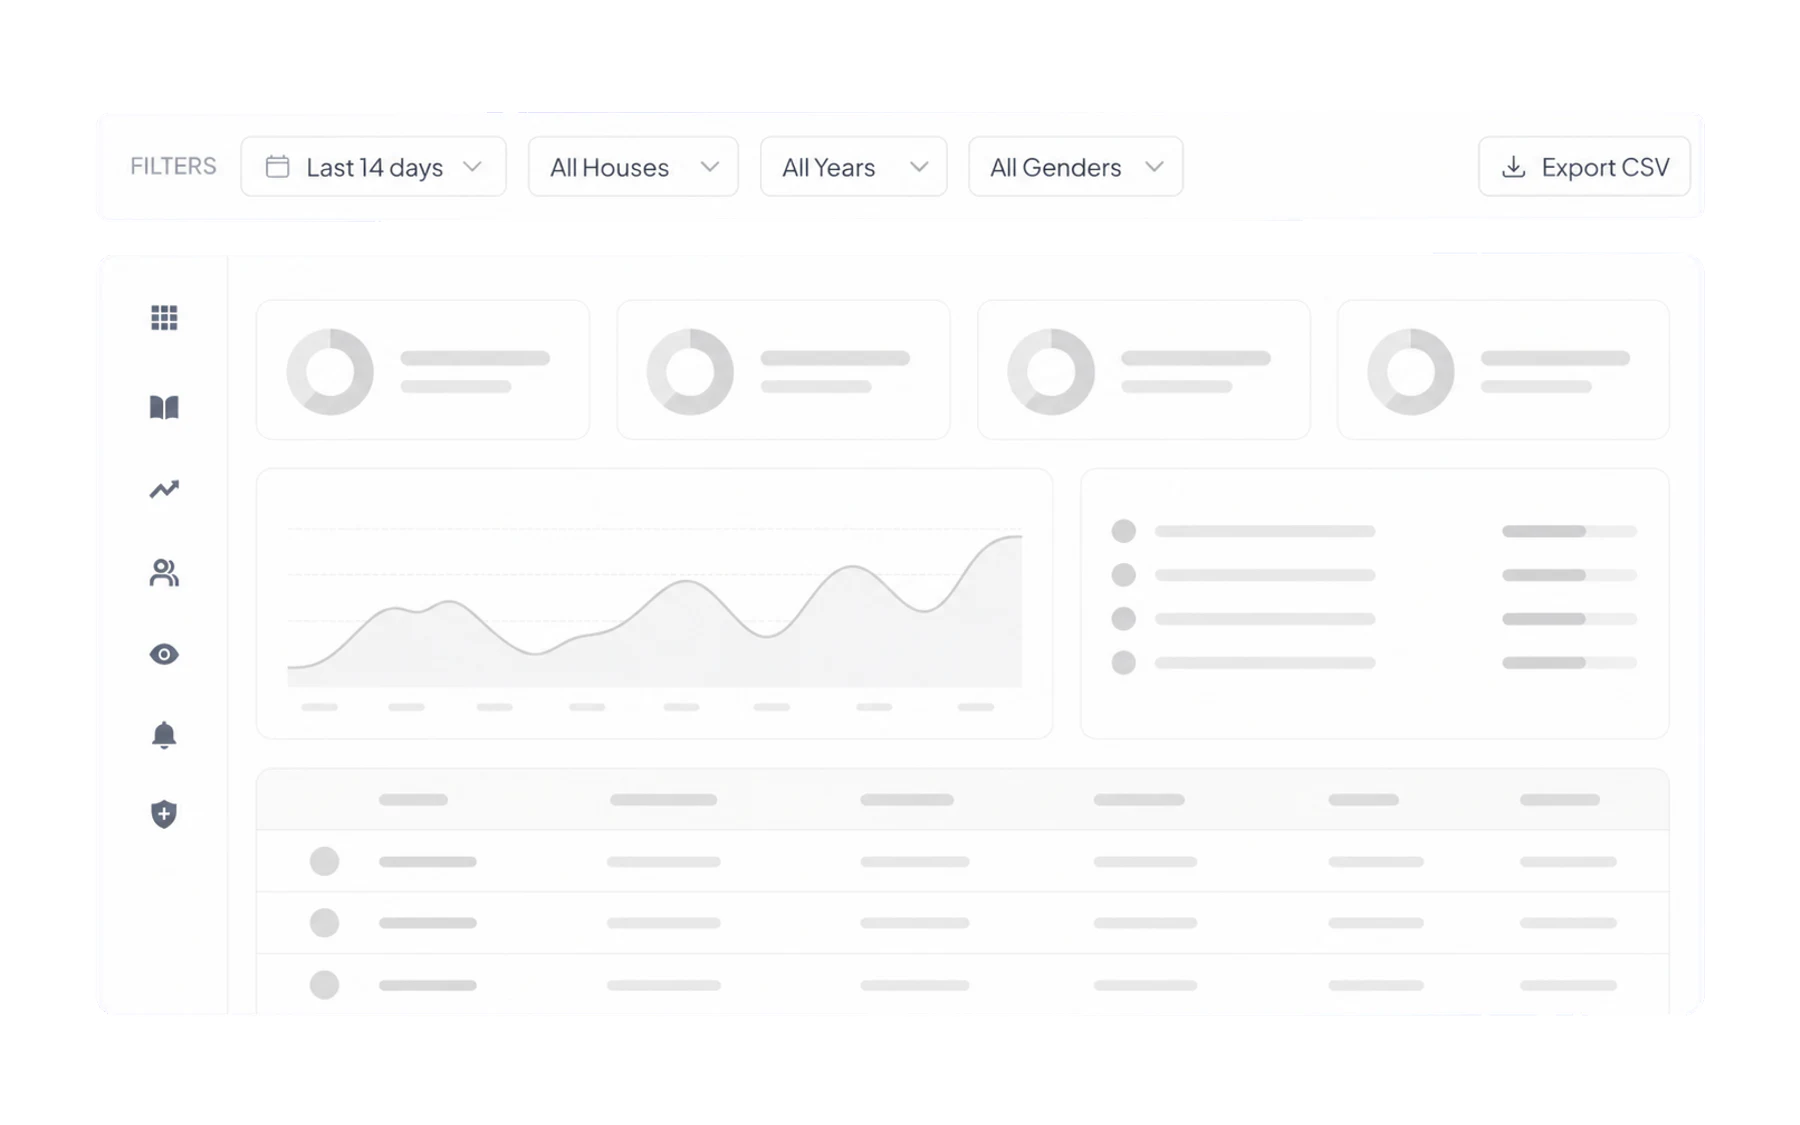
The four filters
- Date range. The one that matters most. Last 14 days for “what is happening now”; a term for “is this getting better”. Compare like with like — a fortnight containing a public holiday is not a normal fortnight.
- Houses. For schools running a house system, the natural unit of pastoral responsibility.
- Year levels. Different year levels have different timetables and routines, so an all-years average may not describe either group well.
- Genders. Use with care. It is there for genuine equity questions — for example whether bathroom access differs across cohorts — not for browsing.
Turning a question into filters
“Are Year 9 out of class more than the rest of the school?”
Set the range to this term. Read Total Passes and Unique Students with no year filter, then with Year 9 selected. Compare passes per student, not raw totals — the year groups are different sizes.
“Has the new bathroom policy worked?”
Set the range to the four weeks before the change and note the Out of Class total, then the four weeks after. Keep every other filter identical. If term dates or a holiday fall inside one window, say so when you report the number.
“How do I retrieve records for an approved support review?”
Start with the student or group already in the school’s authorised support process, then set the relevant date range and open Student Profile. Do not use the school-level table to select students for intervention based only on a high count.
“How much open-pass time was recorded?”
Set the range and read Lesson Time Missed, the current interface label for summed pass duration. It measures recorded open-pass time; it does not verify physical absence or the amount of learning missed.
Two ways to be wrong
- Reading a small group as a trend. Filter hard enough and you can reach a cohort of six. Percentages there are noise.
- Mistaking recording for behaviour. A spike right after a staff meeting about recording passes usually means staff started recording passes. Ask what changed before you conclude what changed.
Taking it away
For authorised users, Export CSV takes the underlying Vero records for the current filters — not just the rows on screen. Export only what is necessary for the approved purpose and handle the file under your school’s privacy and retention requirements. See Export to CSV.